Our Stock Price Projection Calculator is built on an optimized standard model inspired by the Probability of Expiring Cone Study. It estimates potential up/down price targets based on a stock’s Implied Volatility (IV) for a selected expiration date.
How It Works:
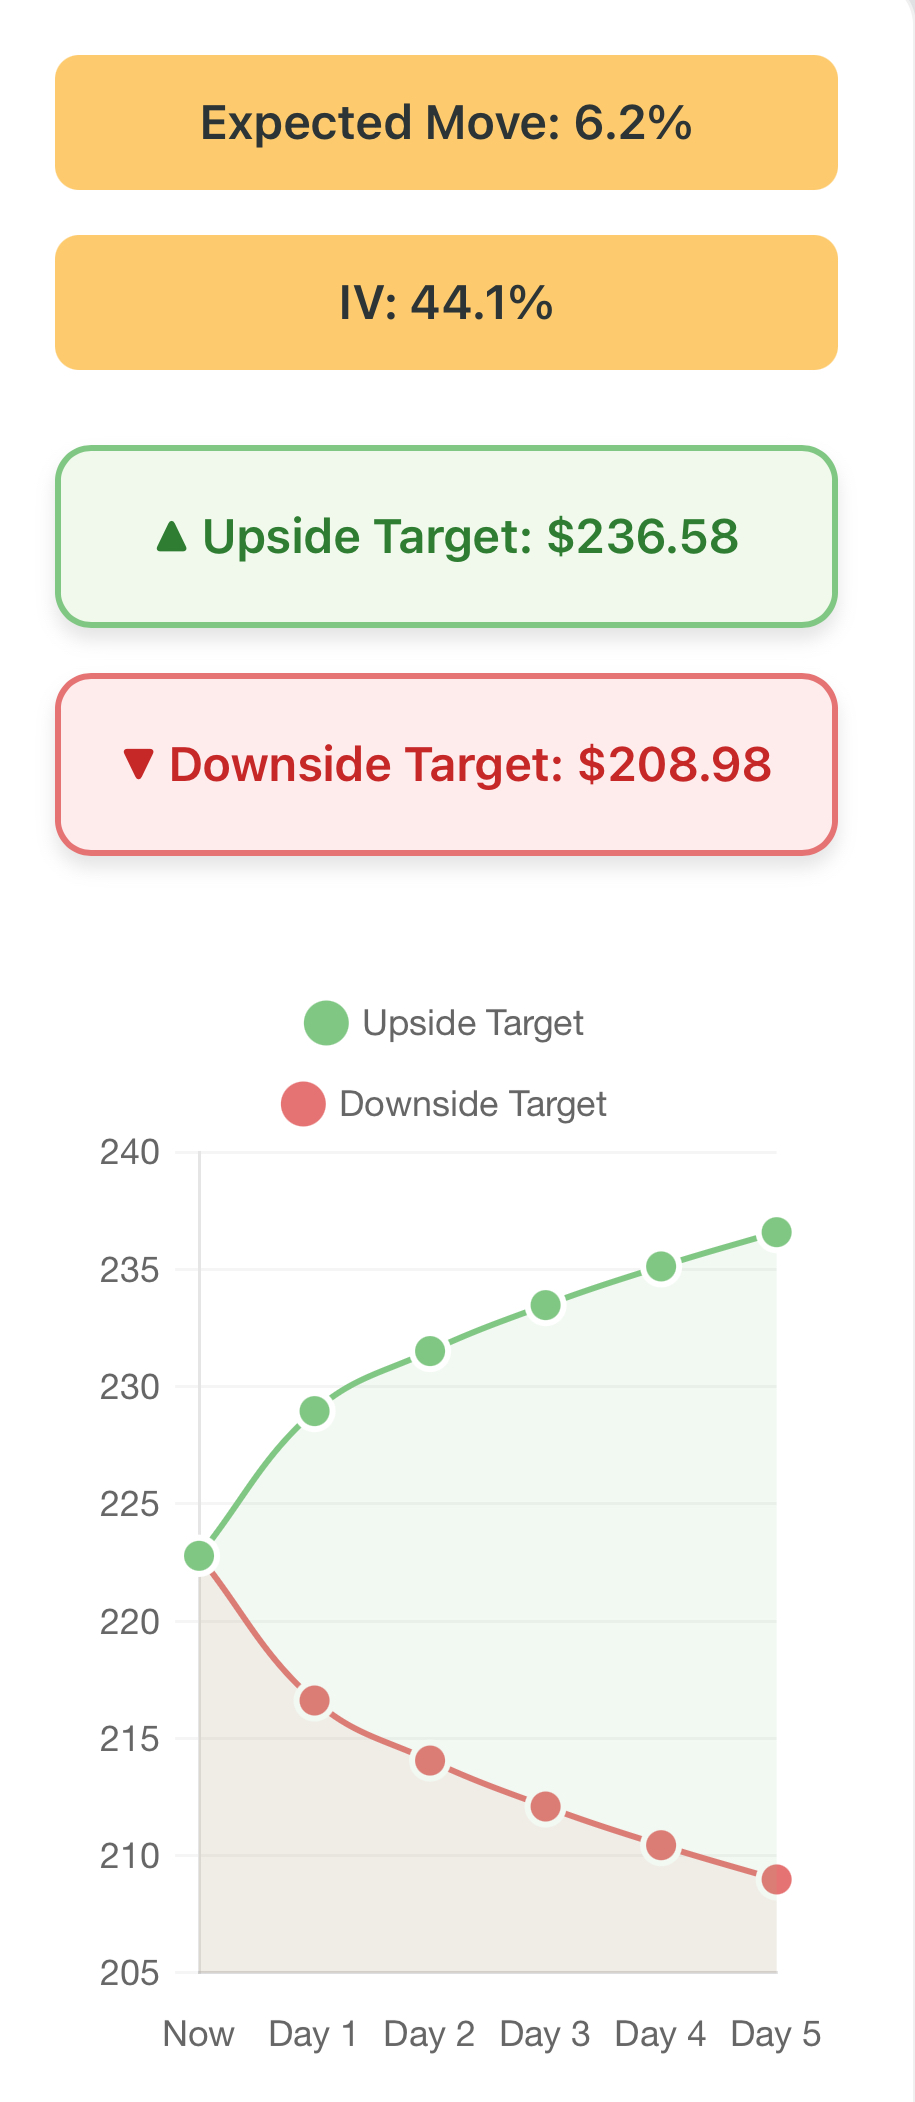
The calculator provides two projected price levels, indicating where the stock is likely to move by the chosen expiration date.
Ideally, the stock is expected to close within the projected range. However, daily fluctuations and constant changes in Implied Volatility (IV) can sometimes push prices beyond their standard deviation. By staying prepared, you can either seize these opportunities or recognize when it’s time to be cautious.
Why Use It?
By combining these projections with other technical indicators and valuation tools, you can gain an edge in making more informed trading and investing decisions.
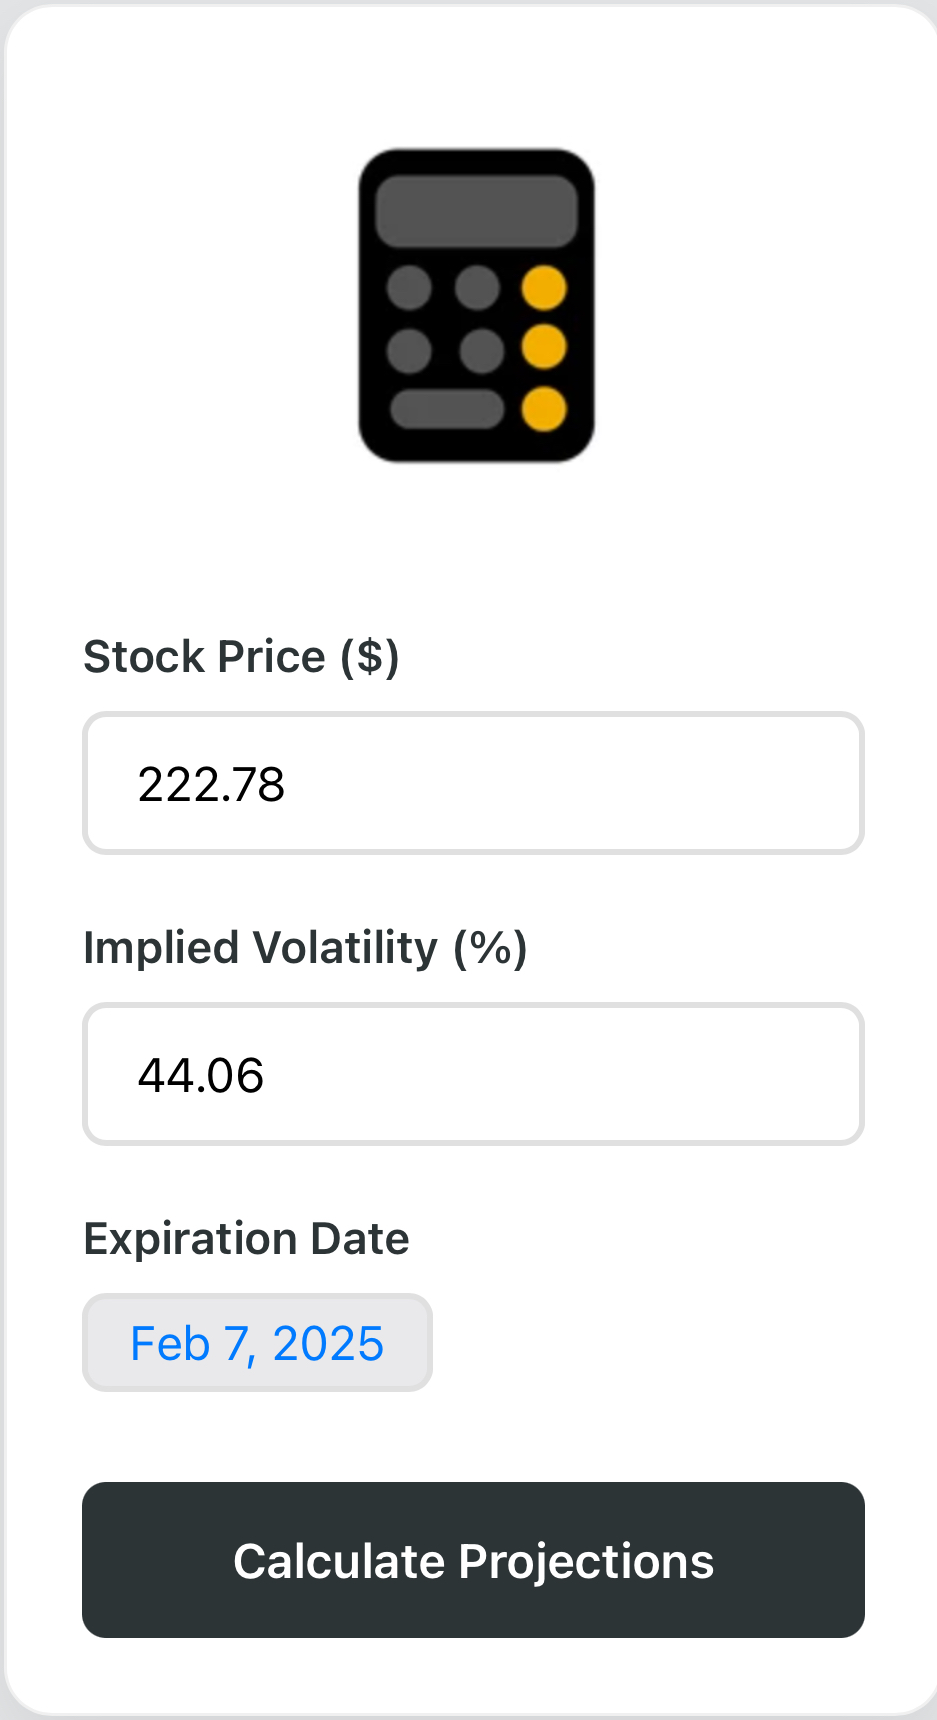
Step 1: Enter the Stock’s Closing Price
Input the stock’s closing price.
For more relevant calculations, consider using the Friday closing price, as it marks the end of the weekly candle and may provide better insights.
Step 2: Enter the Implied Volatility (IV)
You can either use the IV provided by your brokerage or apply a projected IV based on market expectations.
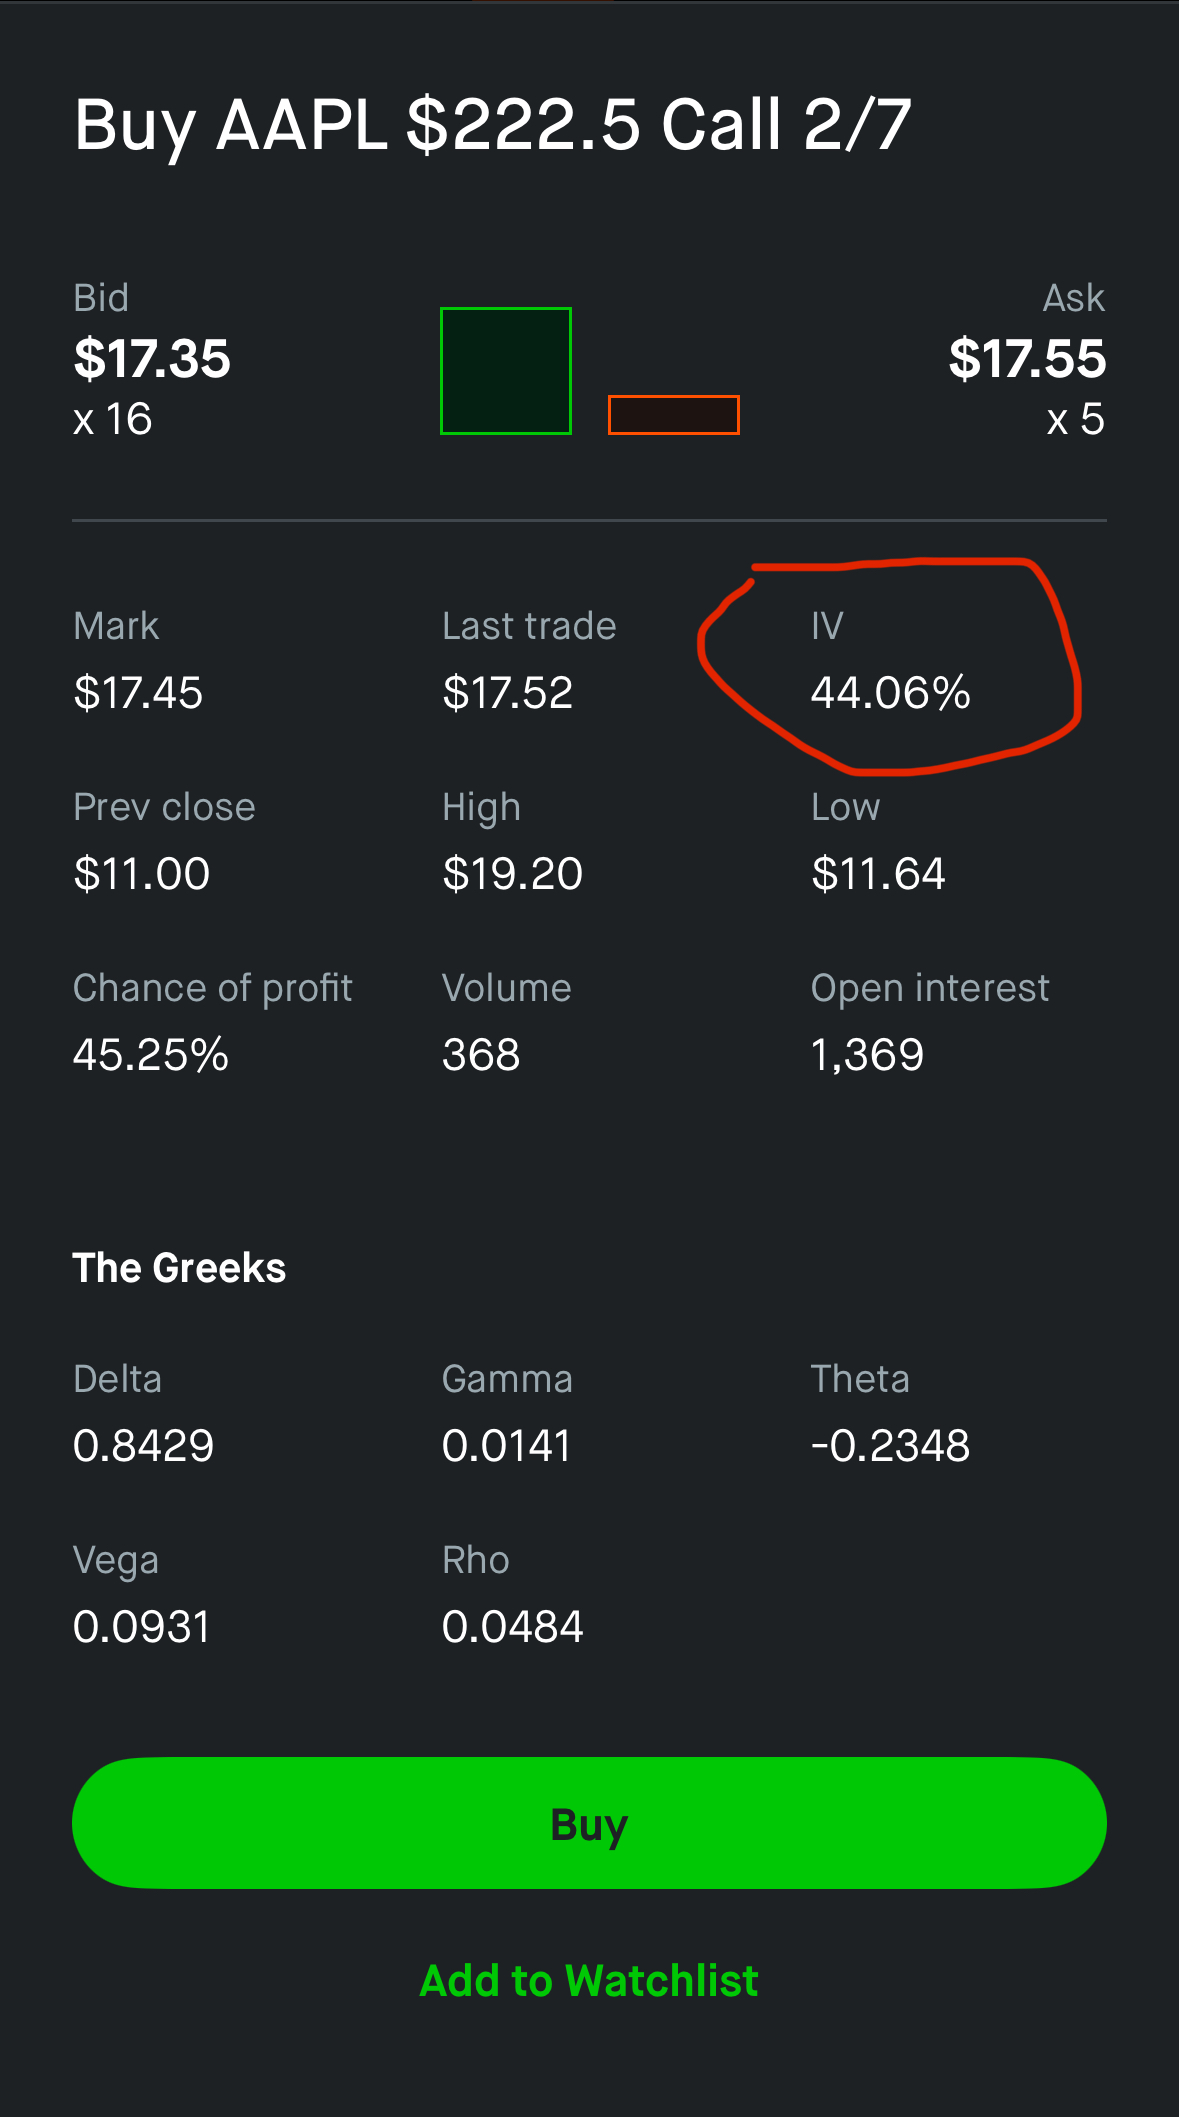
To find the IV, check the options chain for the strike price closest to the stock’s current price and select the IV for your chosen expiration date.
Example: If $AAPL closed at $222.78 on a Friday, check the option chain for the next Friday’s expiration to get the most relevant IV.
If major market events (e.g., Fed announcements, Earnings, etc) are expected, you might adjust IV higher to account for potential volatility.
Example IV: 44.06%
Step 3: Select the Expiration Date
A minimum of 5 days is recommended. But you can estimate any date.
Choose the expiration date that aligns with the contract you referenced in Step 2 and click on “Calculate Projections” to see the results